Basic Analytics
With the basic analytics feature, you can review changes in the numbers of users, KiiObjects, and things. Such changes are automatically aggregated and available in the developer portal.
The results of the basic analysis are available in the following sections in the developer portal:
Unlike the flex analytics feature, the latest changes will be reflected in the analysis results in near real-time.
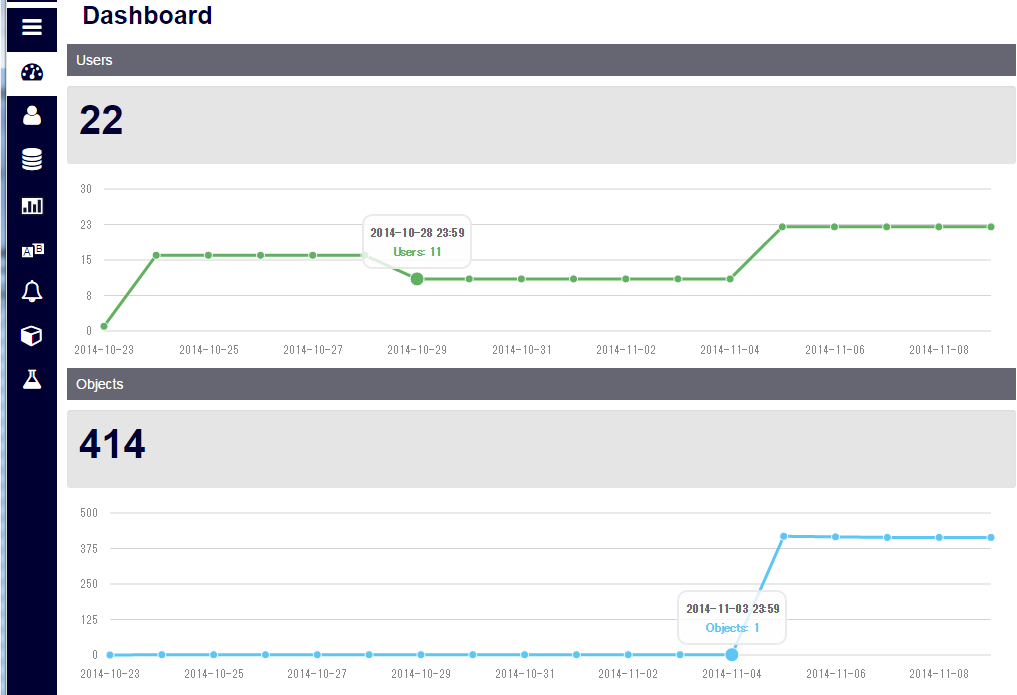
Dashboard
The dashboard for your application opens as below after you select it in the developer portal.
The dashboard shows the cumulative values for the number of users and the number of KiiObjects as an overview of the application. See the sections below for these metrics.
"User" metrics
Click the "User" icon in the left pane of the developer portal to show the report about the user metrics.
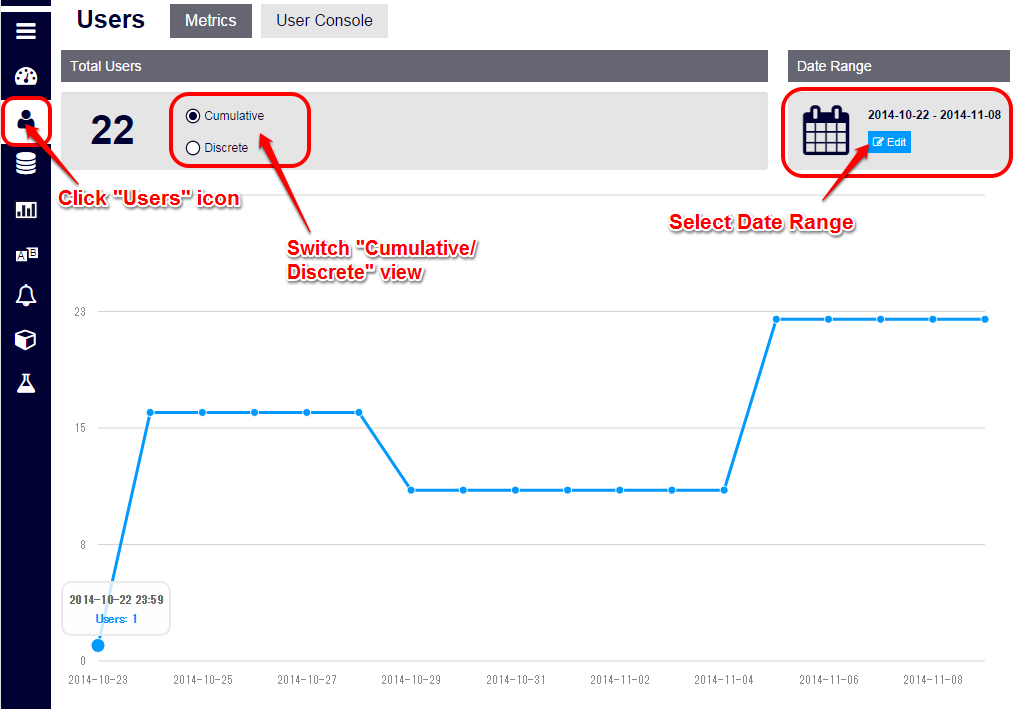
The graph shows the number of users.
You can toggle "Cumulative" and "Discrete" views. "Cumulative" view will give you the total number. "Discrete" view will give you the number per day.
You can also change the data view range (e.g. 1 day, 1 week, 1 month).
"Object" metrics
Click the "Object" icon in the left pane of the developer portal to show the report about the object metrics.
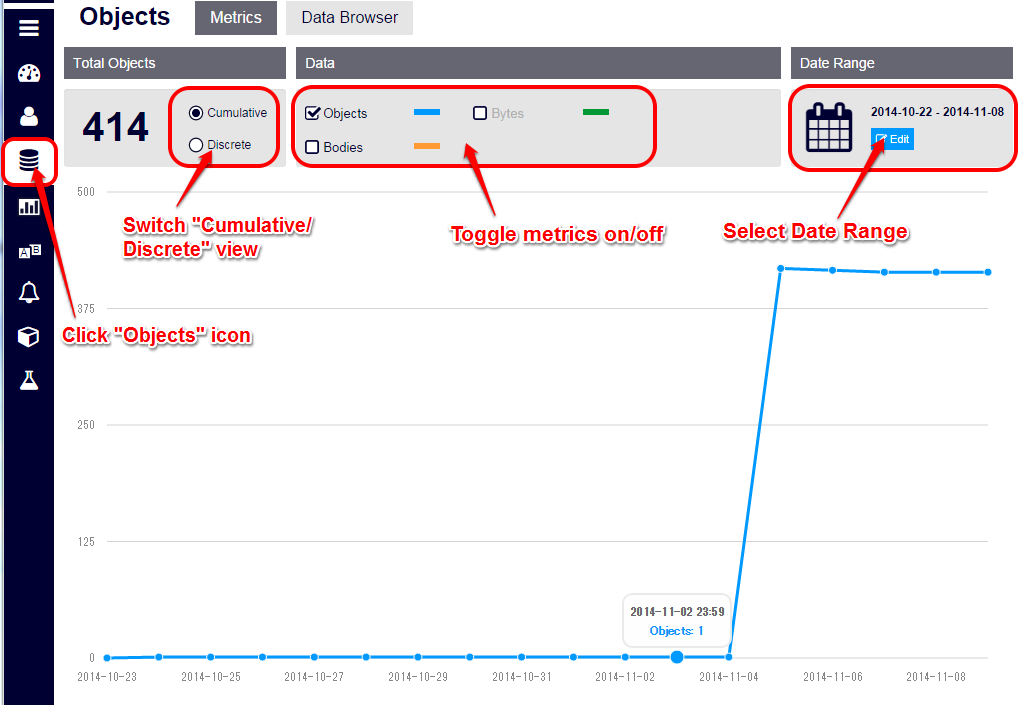
You can view the following metrics on the graph:
- Number of KiiObjects.
- Number of object bodies.
- Size of object bodies (in bytes).
You can toggle "Cumulative" and "Discrete" views. "Cumulative" view will give you the total number. "Discrete" view will give you the number per day.
You can also change the data view range (e.g. 1 day, 1 week, 1 month).
Note:
You might find the number of KiiObjects increasing when you use the following features that save data of configuration and internal processing as KiiObjects.
- Developer portal
- Data browser (saving the query)
- Thing console
- Thing Interaction Framework
"Thing" metrics
Click the "Thing" icon in the left pane of the developer portal to show the report about the thing metrics.

The graph shows the number of things.
You can toggle "Cumulative" and "Discrete" views. "Cumulative" view will give you the total number. "Discrete" view will give you the number per day.
You can also change the data view range (e.g. 1 day, 1 week, 1 month).