Basic Analytics
The basic analytics is a developer portal feature for checking the application usage quickly. It is "out-of-the-box" analytics, so you can start using it without any special configuration.
The basic analytics shows the transitions of the number of users, KiiObjects, and things registered in your application in graphs.
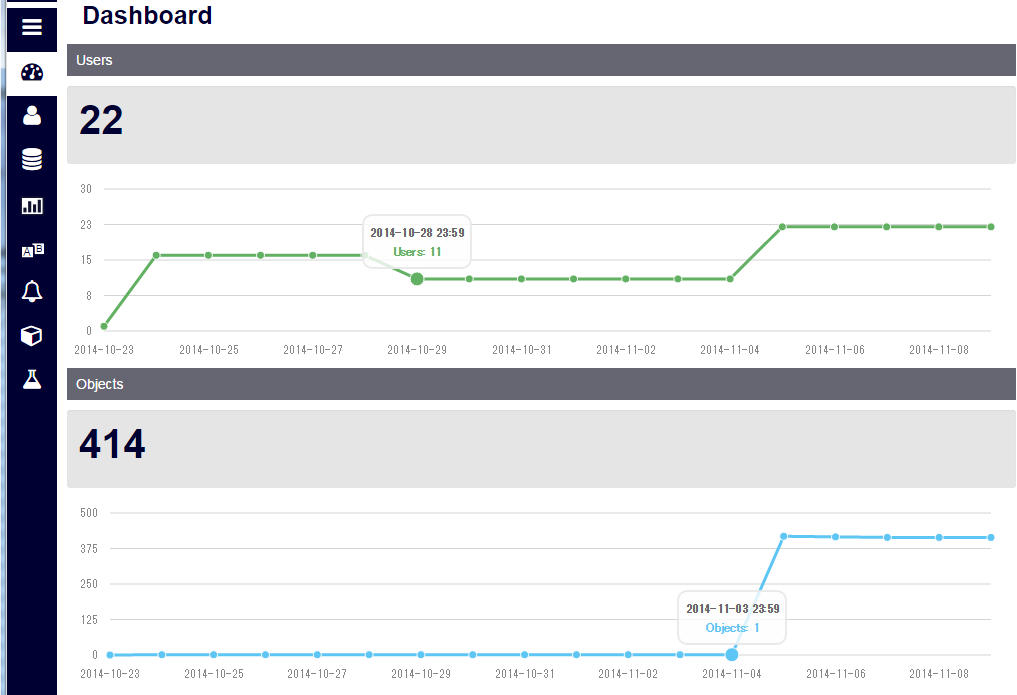
The above screenshot is a dashboard screen that you will see right after selecting an application on the developer portal. The graphs showing the transition of the number or users and KiiObjects will be displayed as the default screen.
Once you move to the management screen, you can check the transition of users, KiiObjects and things at any time period.
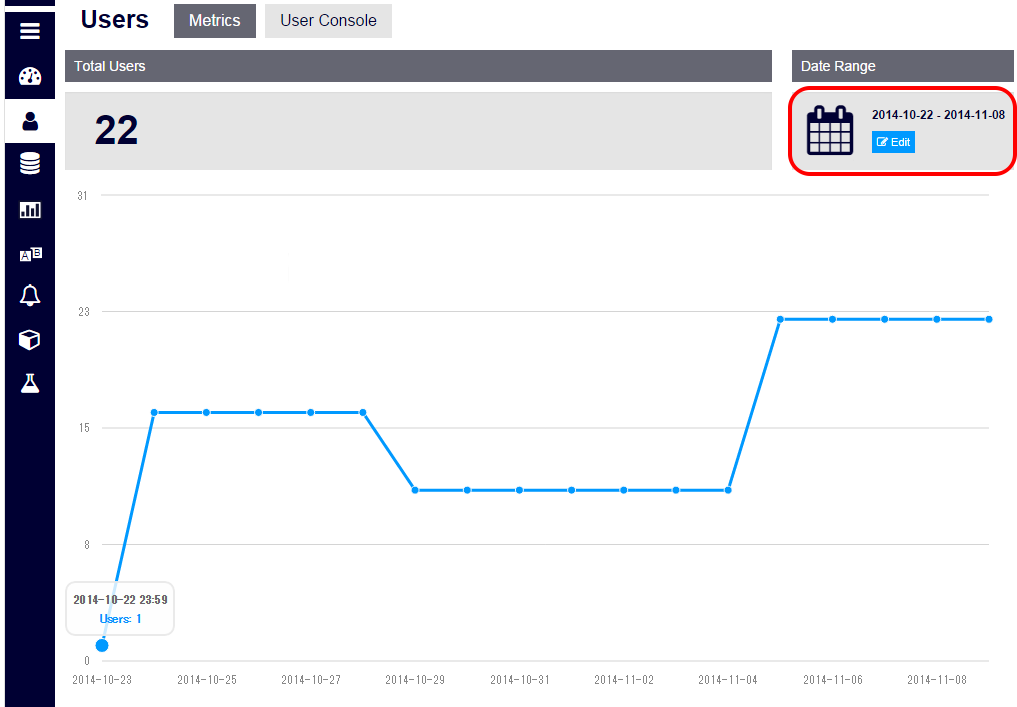
The basic analytics allows you to grasp the usage of your app without any configuration. For example, you can evaluate the effect of campaigns and events by checking the transition of users. You can also check the transition of KiiObjects to estimate how your users are using your app.
To learn more...
See "Basic Analytics" (Android, iOS, JavaScript, REST) in the reference section to learn more about the basic analytics.